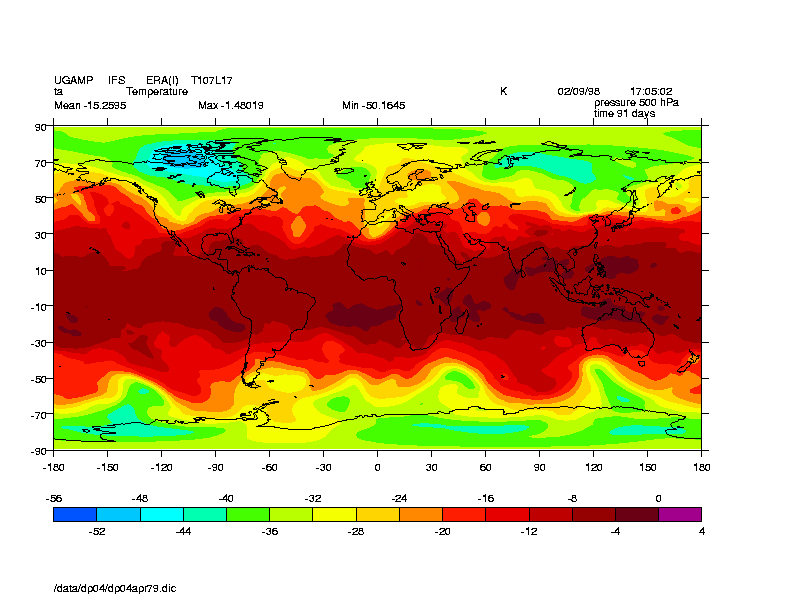
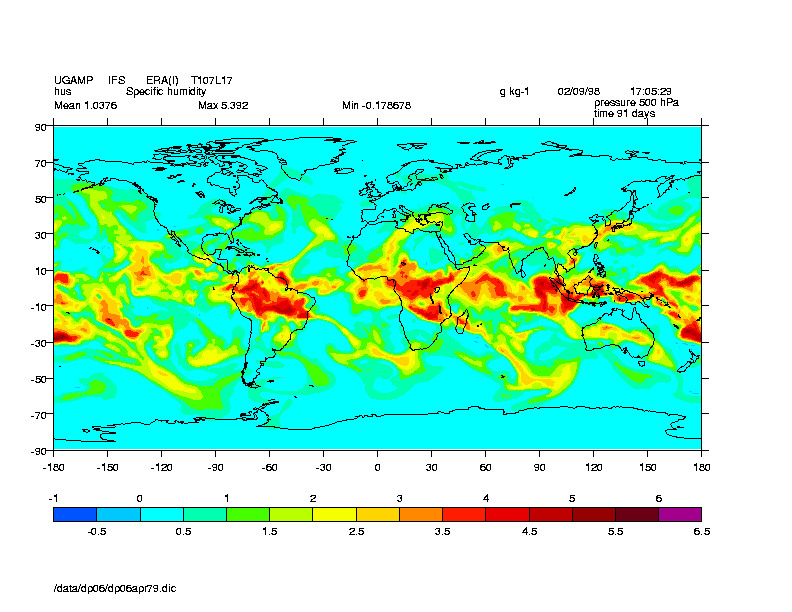
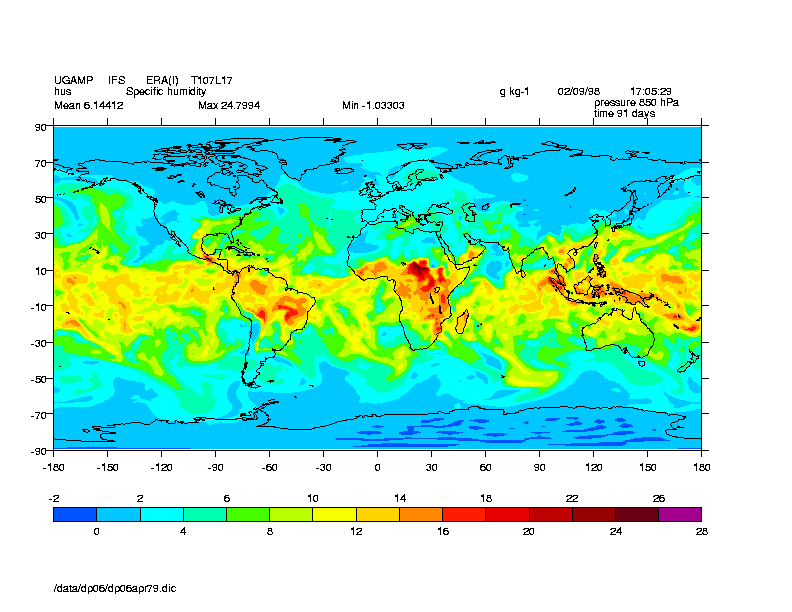
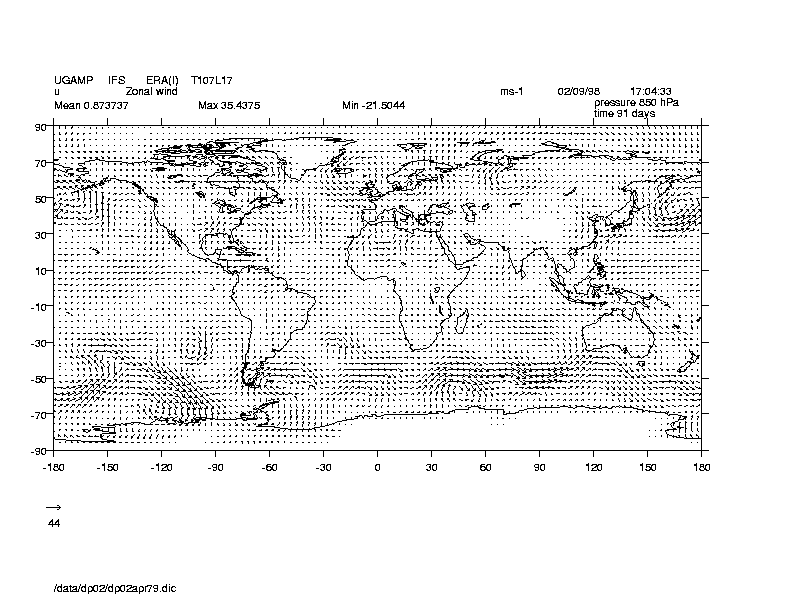
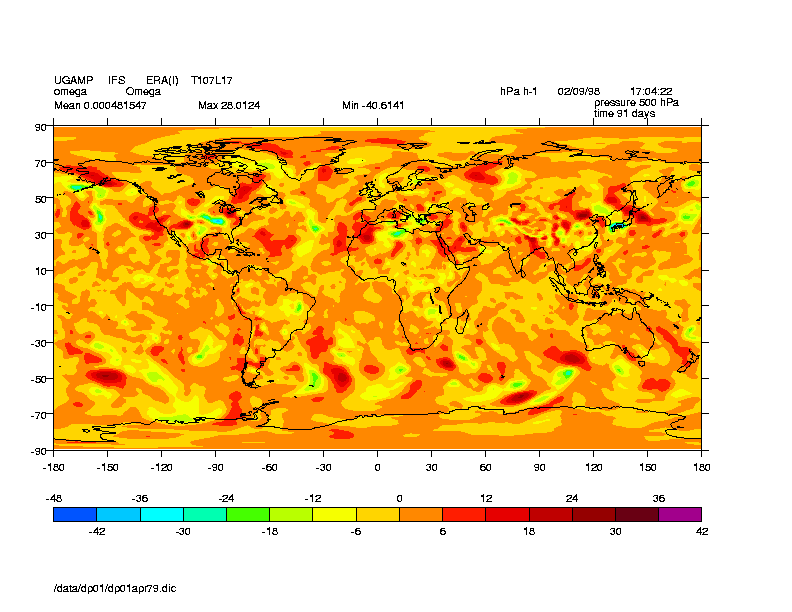
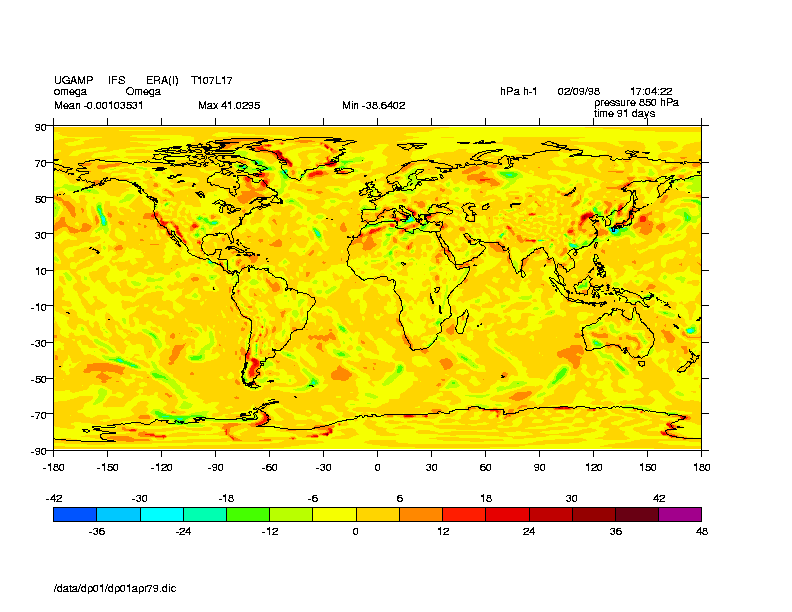
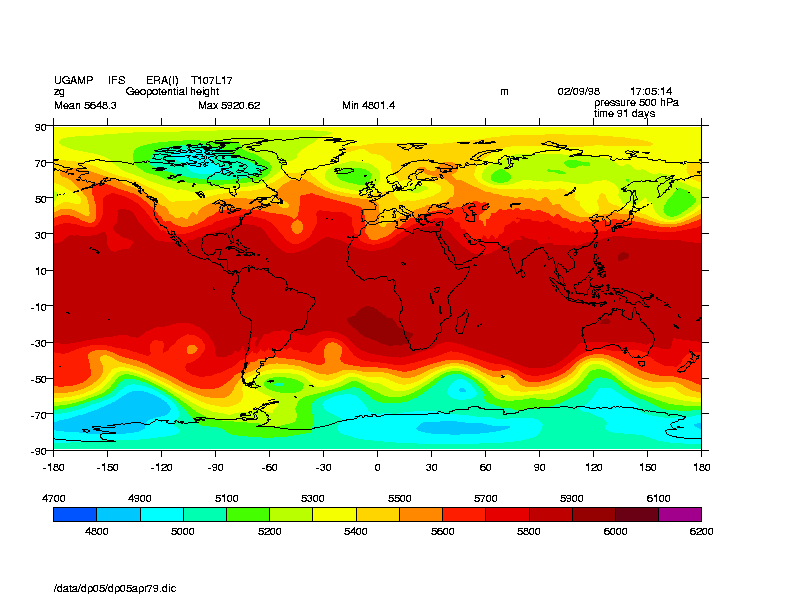
Data for the 4th of April 1979. Plots are of Temperature, Specific humidity, winds, vertical velocity and Geopotential Height on the 500 and 850 mb levels.


Plots courtesy of Paul Berrisford, CGAM Reading.
Data for the 4th of April 1979. Plots are of Temperature, Specific
humidity, winds, vertical velocity and Geopotential Height on
the 500 and 850 mb levels.
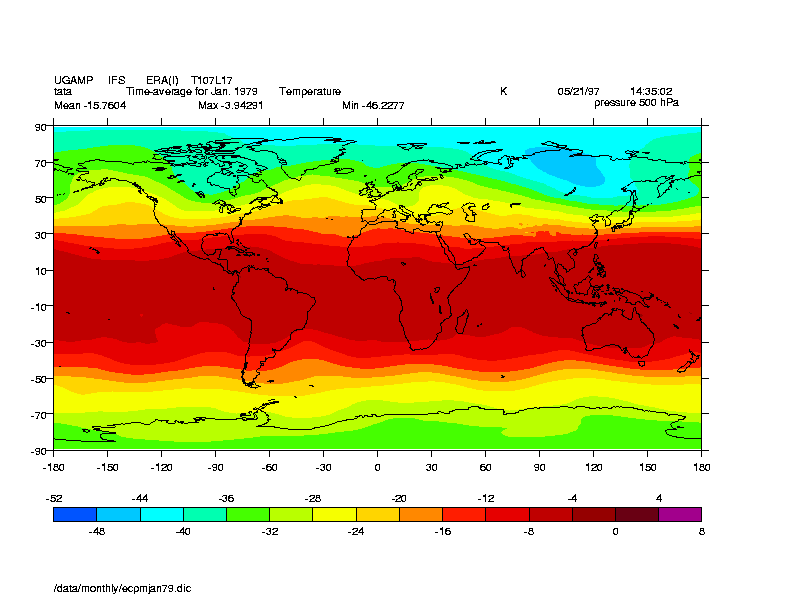
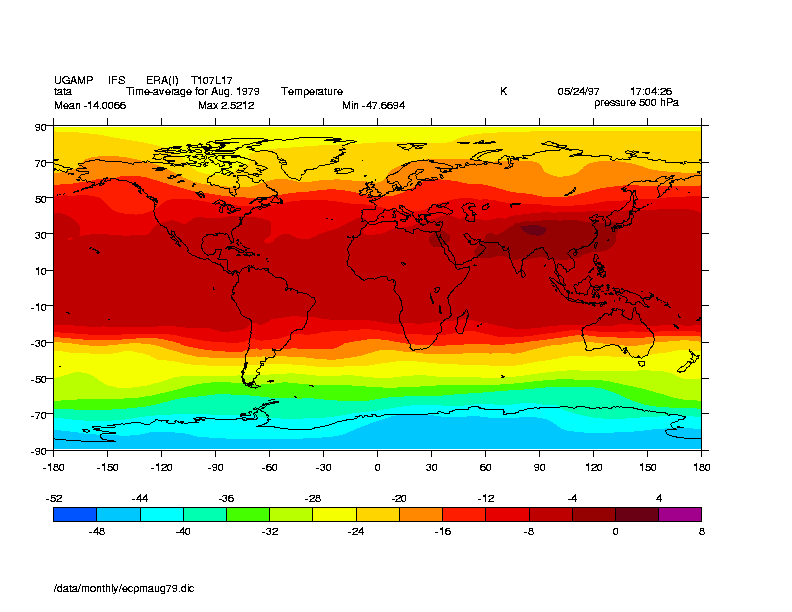
Plots are of Temperature on the 500mb level for January and August.
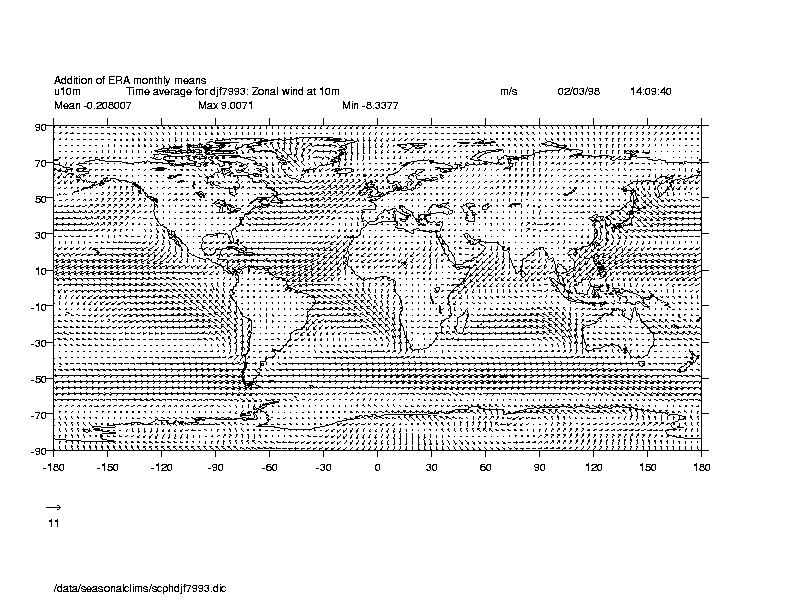
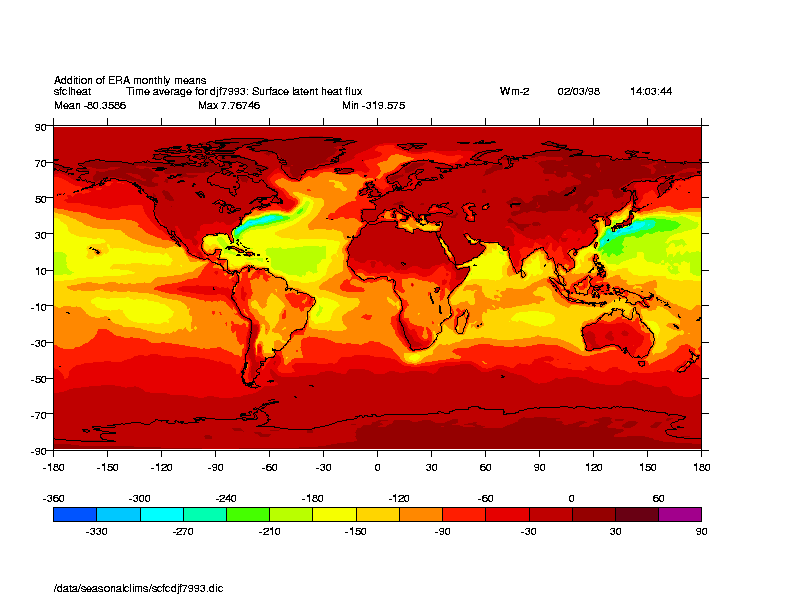
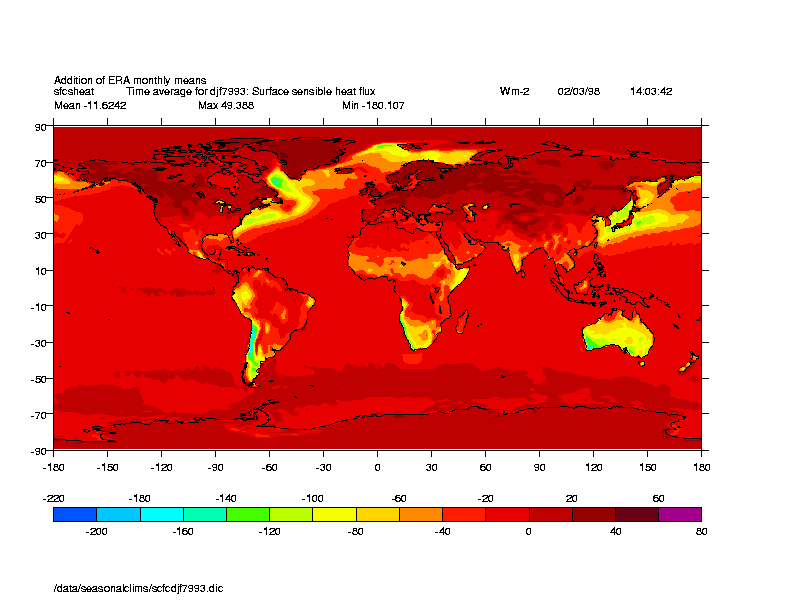
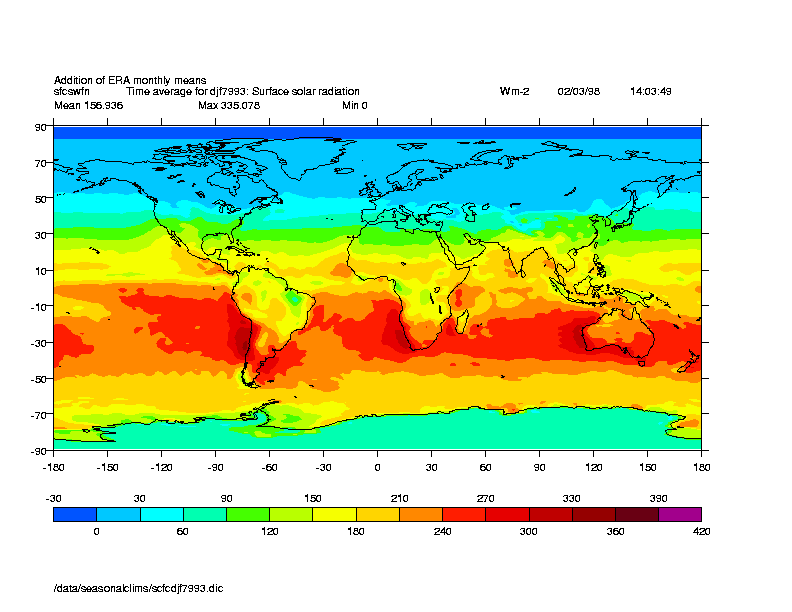
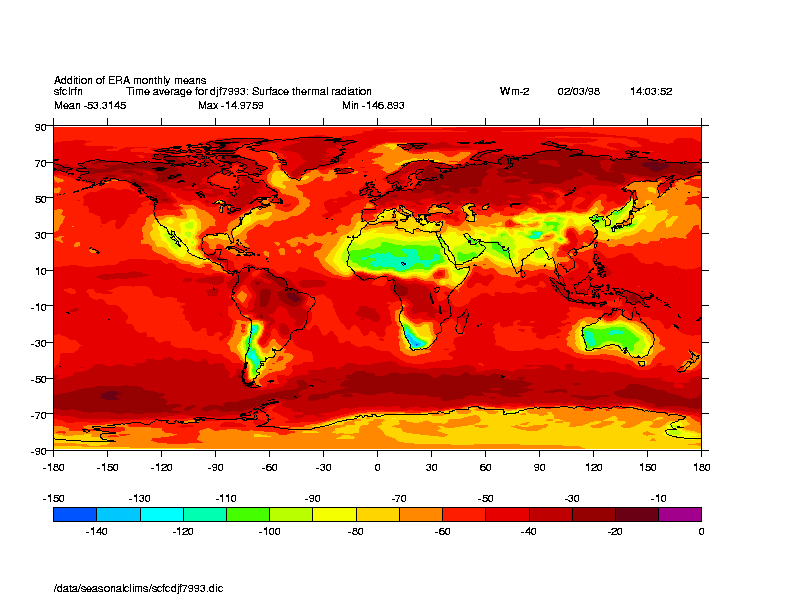
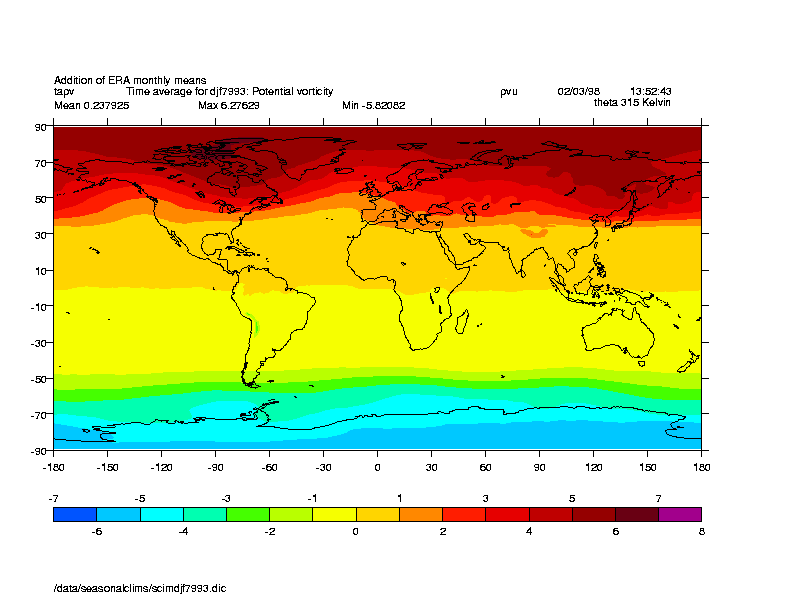
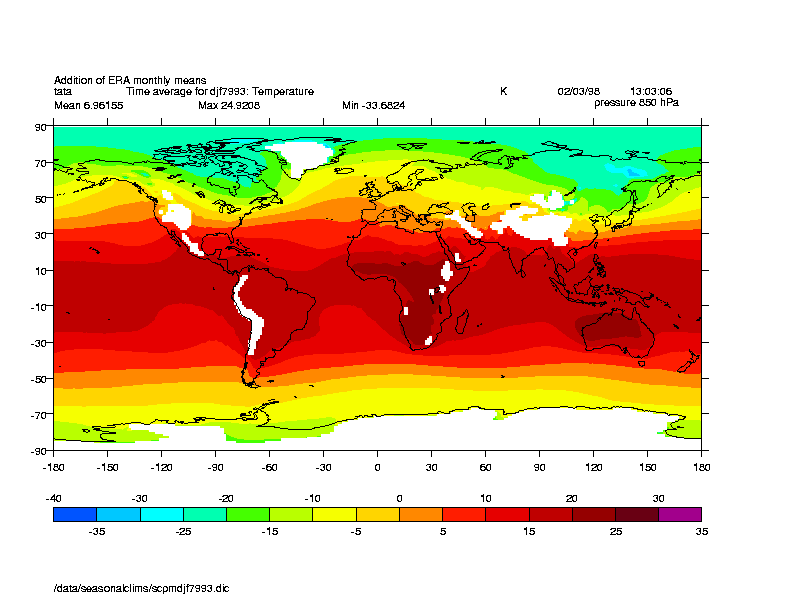
Plots various parameters on the surface, pressure and isentropic
and constant PV (Potential Vorticity) levels for averaged December to February 1979-1997
data.
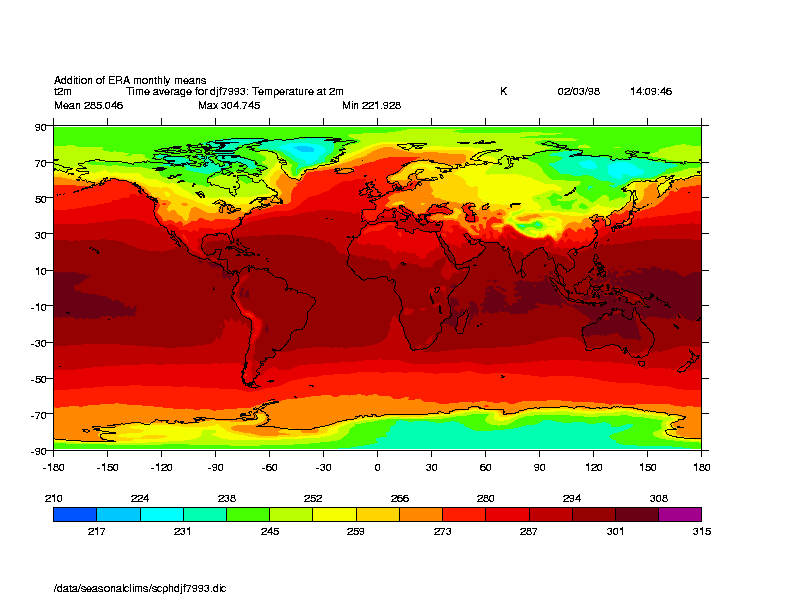


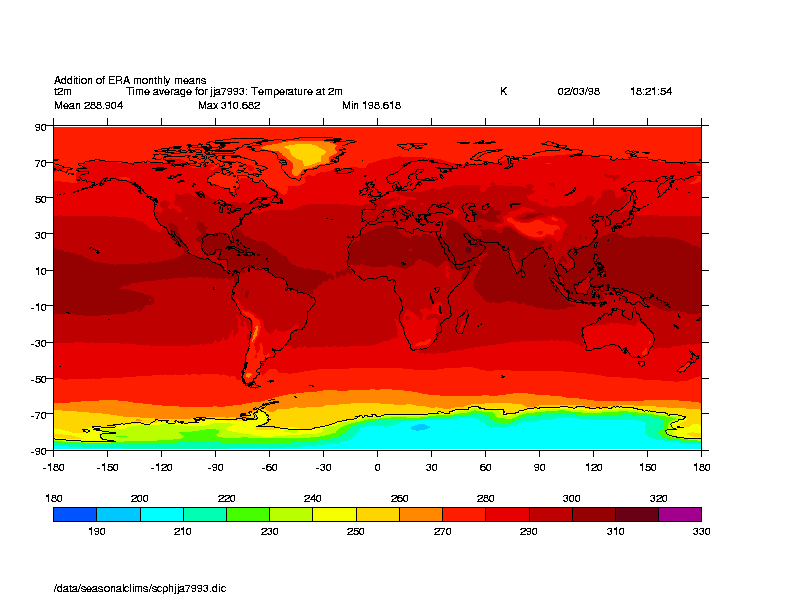
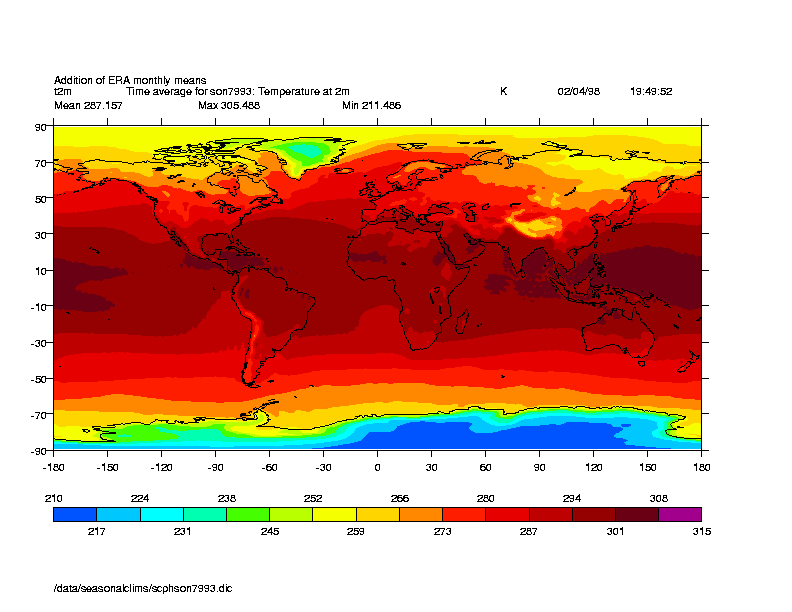
Average 2 meter temperature for the four seasons .