The latest version of the CRU TS data is available for extraction using the CEDA Web Processing Service. Subsets of the CRU TS data may be extracted (e.g. data from a specific geographical area for a defined period of time).
In order to use the CEDA WPS, you must be registered with CEDA (new users should register here).
The extracted data will be available through the WPS.
The data output file format is either NetCDF or CSV. Explanation about how to read the CSV file format is provided below. Note that CSV files can be directly imported into MS Excel.
The CEDA WPS has been tested with the following browsers:
If you test the CEDA WPS in other browsers and it works, please let CEDA Support know.
Update 31/03/2014: Some issues have been reported using the WPS in the latest versions of Chrome and Internet Explorer. We recommend that you use Firefox.
If you discover a problem with the CEDA WPS service please notify CEDA Support. When reporting a problem please include the following information:
Please note that the CEDA WPS service is continuously being developed. The following list gives the improvements that will be made in the future:
If you think anything should be added to the list, please contact CEDA Support.
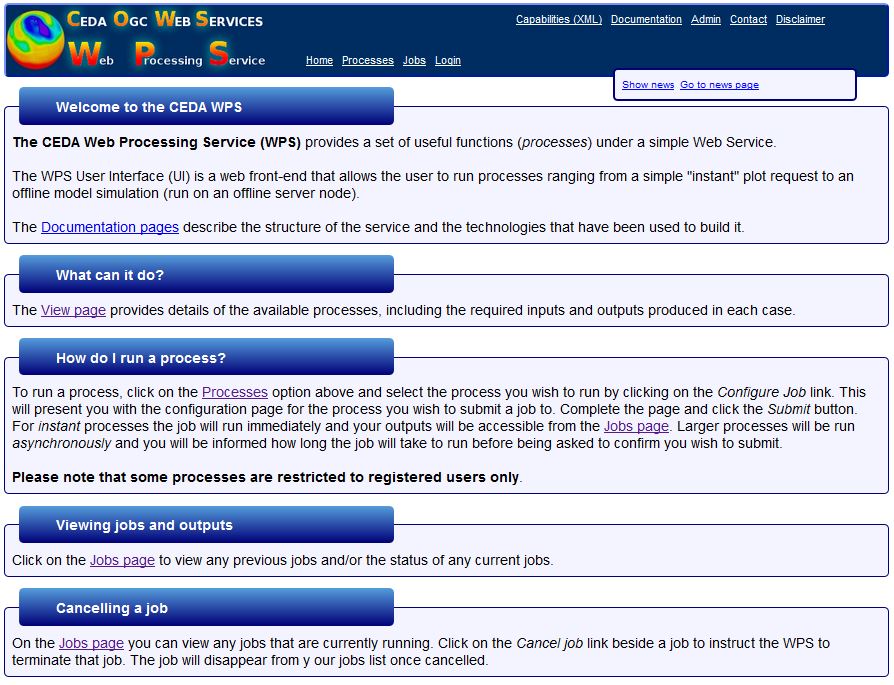
On the home page, you can find summaries briefly highlighting what CEDA WPS is, What it can do, How to run a process, how to view jobs and outputs and how to cancel a job.
Also on this front page and available throughout all CEDA WPS website pages is the top menu bar with direct links to Home, Processes, Jobs, Login as well as News. You can also find a contact link on this menu bar on the right-hand side.
All job processes currently available under the WPS are detailed under the "Processes" in the top menu bar (left side). As the service develops, additional processes will be described on this "Processes" page.
The procedure is straightforward and in 4 steps, as follows:
Details to successfully complete each step in this procedure are given below.
To start submitting a job to extract some data via the WPS, follow the link to "Processes" on the top menu bar.
The Subsetter process is a subsetting tool that allows the extraction of variable subsets from a range of datasets. The user can select a dataset, a single variable, time range and bounding box. The output format can also be selected (NetCDF or CSV) along with instructions on how to divide output files into sensible time chunks. The tool uses CDAT's CDMS (Climate Data Management System) libraries to interact with the datasets in the archives. The extraction jobs run on the batch processing servers and the user is e-mailed when the job has completed.
At this stage, you can either scroll down the page until you find the job process of interest (in this case "Subsetter") or you can filter the list by entering a keyword (i.e. subsetter). Simply click on the job process title bar or follow the link to "submit a request" on the job process title bar.
Full documentation on the Subsetter tool is available at: http://ceda-wps2.badc.rl.ac.uk/docs/cows_wps/supported_procs/subsetter_process.html
You shoud now see a page entitled "Define the inputs for the Subsetter process". This is the page where your define your criteria to extract the data of interest.
Fields to be defined are:
Click on the Submit button at the bottom of the "Define the inputs for the Subsetter process" page.
You should now see a page which gives you details about your job (Information about your asynchronous job page) and in particular the estimated duration and estimated volume. Click on the Submit button to run the job and extract the data as per your request. Upon submitting your job, the server will be contacted and you should then see a monitoring page with your job details (Job: job id number page).
Monitoring your job: job id number page As your job is running on the server, the monitoring page shows your job details, and eventually below the job details, your job output files will be listed (you should see a link to download a zip file containing all the netCDF/csv files listed below). Note that the job id page will continue to poll offline jobs when they are running unless you click the "stop polling" option when it is visible.
IMPORTANT NOTE: Immediately after you have confirmed to run your job, you can either log out or submit another job while the job you just submitted is running. At this point, your job has been submitted to run offline on the server. Please note that offline jobs are scheduled and may take a long time to run. You will receive an e-mail when your offline job has run so you do not need to stay on this page i.e. you may submit additional jobs. Note that you can view all previous jobs and the status of those jobs currently running on the Jobs page (link on the menu bar). This page lists all the jobs (in the lower part) you have submitted to the WPS. The upper part of the page allows you to quickly find a specific job.
You will receive an e-mail when your offline job has run. To find your job outputs, either follow the link provided in the email message or go to Jobs (top menu bar). This page lists all the jobs (in the lower part) you have submitted to the WPS. The upper part of the page allows you to quickly find a specific job. To find your job outputs, follow the job associated link to View job info/outputs. The View job info/outputs displays the job details in the upper part and list the output files in the lower part of the page.
Once you have submitted all your data extraction jobs, you should logout by simply clicking on the logout link on the top menu bar.
It contains a Header and a Data section as shown in this example:
The header contains the metadata (i.e. information about the data extracted) and should be self-explanatory.
The data section can be best explained following an example.
Say that PET data has been extracted for a specific geographical area between 96.75W,43.75N and 91.75W,48.75N for the whole year of 1901.
The CRU TS grid is 0.5x0.5deg and as explained in the File_Format_explained PDF document available from the CRU TS dataset catalogue record, the 360-lat x 720-long grid is presented exactly as that, with 720 columns, and 360 rows per timestep. So the first row in each grid is the southernmost (centred on 89.75S). The first column is the westernmost (centred on 179.75W). So if one is extracting the whole grid, one would get the whole global grid (i.e. 360 rows) for the first time step, then the whole grid for the second, and so on.
When one extracts a subset of the data however, only a limited number of grid cells are extracted - in the example given above, only 11 cells of the grids (96.75W,43.75N and 91.75W,48.75N) are requested so one should only expect 11 rows of data for Jan 1901 (highlighted in green in the example below), then next 11 rows the data are for Feb 1901 and so on until December 1901.
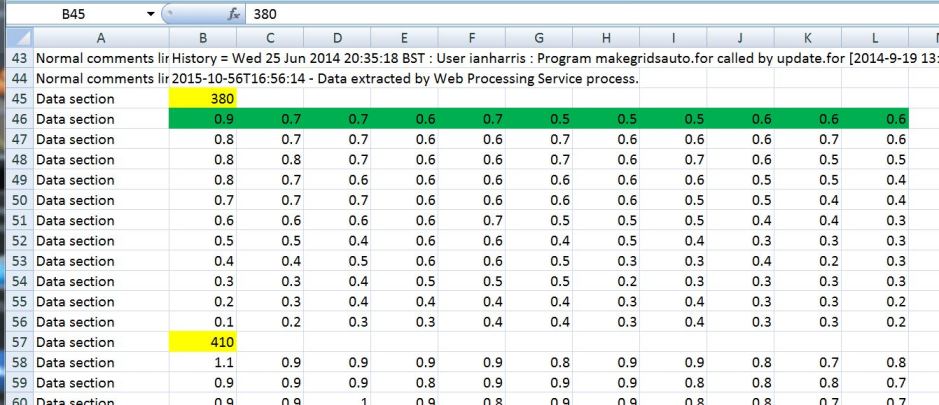
The first and unique number that appears above the gridded data (see highlighted number in yellow in the example above) is the time in days since 01/01/1900.
So on the example above, one can see that:
B45 is the time in days since 01/01/1900.
B46 is PET value for grid cell at 43.75N and 96.75W in Jan. 1901
L46 is PET value for grid cell at 43.75N and 91.75W in Jan. 1901
B56 is PET value for grid cell at 48.75N and 96.75W in Jan.1901
L56 is PET value for grid cell at 48.75N and 91.75W in Jan.1901
etc
B57 is the time in days since 01/01/1900, so in Feb. 1901
B58 is PET value for grid cell at 43.75N and 96.75W in Feb. 1901
and so on...
The WPS is still work in progress. If you have queries about it then you should contact CEDA Support. Your query should be answered within one working day. When follow-up work is required, CEDA support will carry out the work as quickly and efficiently as possible, and in any case, the user will be kept informed of progress.