
The ATSR Project
|

A brief explanation of the ATSR cloud screening process
1. Introduction
This is a brief explanation of the basic methods used to screen the ATSR data for cloudy pixels and identify clear sea pixels: for a complete description of the ATSR-1/2 clearing process the user is referred to Závody et al. (2000)
Also as the ATSR Cloud Clearing Scheme is based on the APOLLO algorithms originally developed by Saunders (1986) and Saunders and Kriebel (1989) the user may find these papers useful background to the whole process.
It should be noted that the scheme has been optimised for use over the ocean and as only certain of the tests are/or can be used over land, some improvements in the scheme are necessary before the scheme will work as well as it does over the ocean. The ATSR SST processing software implements the following sequence of cloud tests to identify the clear pixels in any given ATSR image.
2. The Cloud Tests
2.1 The Gross Cloud Test
This test is the simplest of the cloud tests and rejects pixels that are obviously cloudy because they have lower than expected brightness temperatures (BT). It uses that basic assumption that clouds are cold. The 12µm channel is used in this test in preference to the 11µm channel because of the larger cloud optical depth at 12µm.
The thresholds for the expected BTs are derived for the case over the ocean from the UKMO Global Ocean and Surface Temperature Atlas (GOSTA) data set with an allowance for likely atmospheric deficits. The thresholds for required for ATSR-2 are different to those for ATSR-1 because of the increased water vapour absorption in the slightly modified ATSR-2 12µm channel.
Závody, A.M, C.T. Mutlow and D.T.Llewellyn-Jones, Cloud Clearing over the Ocean in the Processing of Data from the Along-Track Scanning Radiometer (ATSR), Journal of Atmospheric and Oceanic Technology, 17, 595-615, 2000.
Saunders, R.W., An automated scheme for the removal of cloud contamination from AVHRR radiances over western Europe, Int. J. Remote Sens., 7, 867-888, 1986.
Saunders, R.W, and K.T. Kriebel, An improved method for detecting clear sky radiances from AVHRR data, Int. J. Remote Sens., 9, 123-150, 1988; Correction 9, 1393-1394, 1989.
2.2 The Thin Cirrus Test
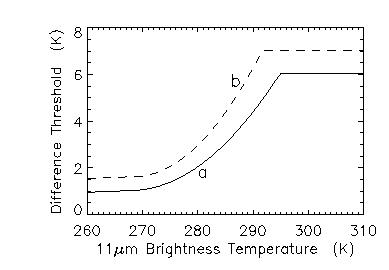
Large differences between the 11 and 12 µm BTs are indicators of the presence of medium- and high-level clouds, and especially thin cirrus. The thresholds on this BT difference test are determined using radiative transfer calculations based on radiosonde data. The scheme includes 5 different across track threshold bands to allow for the across swath air-mass increase, and, in addition, separate thresholds are used of the forward and nadir view cases. The test is formulated with the threshold as a function of the 11µm BT, and a typical set of thresholds for pixels within ±50km of the satellite track is shown below.
|
| Figure 1 Threshold for the 11-12µm test as a function of the 11µm BT. Curve a) is for the nadir view within ±50km of the sub-satellite track, and curve b) the same for the corresponding forward view |
2.3 The Fog/Low Stratus Test
This test relies on the fact that stratus and fog have a higher emissivity at 11µm than at 3.7µm, and hence the 11-3.7µm BT difference can be used for detecting these types of cloud. This is a well-established test and is already used by many other researchers, including Saunders and Kriebel. In our scheme the nadir view threshold is set to 0.9K and the forward view threshold to 1.1K. This test is one of the key ATSR cloud tests particularly over land where spatial coherence tests cannot be used because of surface structure.
2.4 The Medium/High level Test
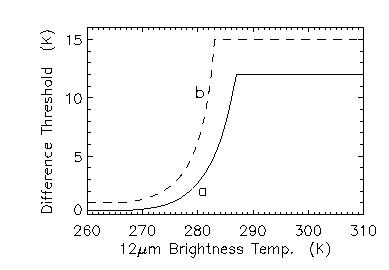
This test is another of those that has been modified from those developed by Saunders and Kriebel, and uses the 3.7-12µm BT difference as a means of identifying semi-transparent and most medium and high level clouds. In the APOLLO scheme pixels were flagged as cloudy when this difference exceeded 1.5K. However, this simple single value approach was found too simplistic for global use so to improve on this ATSR processing uses a variable threshold scheme based on the 3.7-12µm BT differences tabulated as a function of the 12µm BT. An example of these computed threshold values is shown in the figure below.
|
| Figure 2 Threshold for the 3.7-12µm test as a function of the 12µm BT for ATSR-1. Curve a) is for the nadir view within ±50km of the sub-satellite track, and curve b) the same for the corresponding forward view case. |
The threshold functions are different for ATSR-1 and 2 because of the differences between each of the two instruments 12µm channel spectral responses; the ATSR-2 filter is shifted to longer wavelengths.
2.5 The 11µm spatial coherence cloud test
This test investigates the spatial coherence of the 11µm BTs, and operates in two parts: 1) spatial scale of a 3km square sub-image, and 2) on the much larger scale of 128km square sub-image.
These two parts of the test are described in the following sub-sections.
2.5.1 Small-scale spatial coherence
This test relies on that fact that, apart from in active coastal or frontal regions, the sea surface temperature is relatively unifor over areas of a few kilometres square and temperature gradients rarely exceed 0.3Kkm-1. The same is not true of clouds, however, and cloud top temperatures can vary by several, or even tens of, Kelvin in a few kilometres mainly due to variations in cloud top height.
This difference between the texture or spatial-coherence of the ocean and clouds forms the basis of this very powerful cloud test that can be used both in day- and night-time. The threshold value used for groups of 9 (i.e. 3 x 3 sub-sections) ATSR-1 and 2 pixels is 0.2K for the ATSR-1/2 11µm channels.
The scheme implemented actually employs a further enhancement of this method to try to avoid the erroneous flagging of cloud-free ocean data in the region of temperature gradients. This enhancement relies on the fact that: a) the 11-12µm BT difference is largely independent of SST, and b) the atmospheric correction is stable over spatial scales of less that 10km. In this improved test two passes are made over the data. In the first pass nine-pixel groups are classified as either clear or cloudy, according to their standard deviation. On the second pass, those cloudy groups that have at least four of their eight neighbours clear, and which are over the ocean, are checked again. These groups are compared against their clear neighbours, and if the average 11-12µm BT difference is less than 0.1K from the value for its clear neighbours the cloudy group is unflagged and marked as clear.
2.5.2 Large-scale spatial coherence test
The small-scale spatial coherence test works well for some types of cloud but is pretty much useless at detecting uniform stratus, and clouds whose effective temperature is close to that of the sea surface can also evade detection. This large-scale spatial coherence test was designed to cope with this by establishing dynamic thresholds for areas greater that 100km by 100km in size and rejecting any pixels colder than this value as cloudy.
For further details of this test the reader is referred to Závody et al. (2000).
2.6 The 1.6µm reflectance test
Away from sun-glint areas where specular reflection of the sun can occur (depending on the local wind speed), the visible and near-infrared reflectivity of water is very low, whereas in contrast clouds scatter radiation these wavelengths very strongly. Thus, clouds are detected by the strong scattering signal they return. This test is extremely effective at detecting most types of clouds and is the reason why all SST sensors include at least one visible or near-infrared channel specifically for cloud discrimination ( this, and the fact it is better for discrimination of water clouds over ice, is why the ATSR instruments all carry a 1.6µm channel).
Over the ocean the test will only work for reliably for identifying clouds in those regions where the sun-glint signal is relatively small. For this reason this cloud test is split into 3 separate regions based on the effect of sun-glint:, there regions are: 1) the glint-free region, 2) the near-glint region, and 3) the glint region.
These regions are defined by first calculating the angle at which the ocean surface would have to be tilted at the point considered in order to produce specular reflection. If vsun and vsat denote the vectors pointing from a pixel to the Sun and the satellite, respectively, and the unit vector to the local vertical direction is k then the tilt angle τ is given by
|
|
|
The 1.6µm reflectance test is split according to sun-glint regime as determined from the tilt angle above, and ach of these regions is treated differently in the test as follows, because of the markedly different effects of sun-glint in each of these parts of the image.
Glint-free region (tilt angle > 23˚). In the glint-free region the threshold used in the cloud test is determined dynamically from the bright peak in histograms of the measured 1.6µm top-of-atmosphere reflectances for 32km x 32km areas.
Near-glint region (tilt angles between 15˚ to 23˚). This test works similarly to the test described above in (a) for the glint-free case, except that the across-track gradient caused by the variation in sun-glint needs to be removed before the histograms are formed. If this de-trending step is omitted then the test can erroneously flag as cloudy the clear pixels along the east side of the image
Glint region (tilt angles < 15). In these regions of strong sun-glint a spatial coherence test is performed such that the standard deviation in reflectance is estimated for 2 x 4 pixel areas (with its short-side across track to minimise the effect of the glint gradient) and compared to a dynamically determined threshold value. When the calculated value exceeds the dynamic threshold value the area is flagged as cloudy. The determination of the dynamic threshold value is quite complex and the reader is referred to Závody et al. However, it should be noted that in the glint region one further test is performed to mitigate against the theoretical possibility that sun-glint in the 11 and 12µm could contaminate the SST retrievals. Thus, if the 1.6µm reflectance is greater than 90% the data are flagged as cloudy so any potentially sun-glint contaminated 11 and 12µm data are not used to derive SST.
There is a further wrinkle in the way tests (a) and (b) operate which is that if no valid threshold can be determined from the reflectance histogram, the test reverts to the spatial coherence method described under item (c) for the glint region.
2.7 Nadir-view/forward-view tests
These tests are unique to ATSR because there is no analogue for the forward view in the AVHRR instrument. Each of these tests relies on the fairly clear relationship that exists, at least for clear pixels over an ocean surface, between the BTs measured in the two views.
2.7.1 Dual-view test using the 11 and 12µm BTs
This test works by using the nadir view 11 and 12µm BTs to predict the expected 11µm nadir and forward view BT difference. The pixel is flagged as cloudy if the absolute value of the difference between the measured and predicted quantities is greater than a fixed threshold value. These thresholds vary across track to account for the effects of the increased air-mass with off-nadir viewing.
2.7.2 Dual-view test using the 3.7 and 11µm BT
This is performed as an additional test at night when the 3.7µm channel data is available, and is similar to the previous test except that the 3.7µm BTs are used instead of the 12µm BTs. In this test the nadir view 3.7µm minus forward view 3.7µm BT differences and the nadir-view 3.7µm and 11µm BT differences are compared, and pixels flagged as cloudy if they deviate significantly from the expected relationship.
2.8 The infrared histogram test
This test uses the 11 minus 12µm differences and is only performed on those pixels that have not been flagged as cloudy by any of the previous tests.
The test relies on the following.
1. The 11 minus 12µm difference results almost entirely from the effect of the atmosphere.
2. That over distances of a few 100km in cloud free conditions over oceans the atmospheric state is similar.
3. That the residual low stratus clouds that have escaped detection in previous tests affect the BTs differently to the atmospheric effects produced by the clear atmosphere.
4. If the atmospheric water vapour loading is not uniform over the image, and the SST is constant then the lowest BTs correspond to the pixels having the highest water vapour content, and, therefore, the largest 11µm minus 12µm BT differences. This means that the BTs and BT differences are negatively correlated for clear pixels and positively correlated for the cloudy ones.
The test works on the principle that the 11µm minus 12µm BT differences are largest for the clear pixelsan image because of the effects of the atmosphere, and is qualified by the condition described in item (4) above. It is only performed on pixels that have been passed as clear by the previous tests. The threshold used is established using a histogram method.
3. Which Cloud tests are used when?
Each of the cloud tests used in the ATSR cloud screening processing is discussed in the above sections, however it should be noted that not all of theses tests are used in every situation for a number of practical reasons.
The following table summarises the ATSR cloud tests and the situations where they are used; the tests highlighted in green are the only tests that operate over land.
[an error occurred while processing this directive]| Test | Channel(s) | Day | Night | Ocean | Land |
| Gross cloud | 12um | yes |
yes |
yes |
no |
| Thin cirrus | 11/12 | yes |
yes |
yes |
yes |
| Medium/high level | 3.7/12um | no |
yes |
yes |
yes |
| Fog/low status | 3.7/11um | no |
yes |
yes |
yes |
| 11um spatial coherence | 11um | yes |
yes |
yes |
yes |
| 1.6um histogram | 1.6um | yes |
no |
yes |
no |
| 11/12um nadir/forward | 11/12um | yes |
yes |
yes |
no |
| 3.7/12um nadir/foward | 3.7/12um | no |
yes |
yes |
no |
| IR histogram test | 11/12 um | yes |
yes |
yes |
no |
Tests involving the 1.6µm channel can only be used during daylight because the channel detects scattered sunlight, whereas conversely any tests using the thermal signals from the 3.7µm channel cannot be used during daylight because of the risk of them being contaminated by solar scattering. Also, all of the time for ATSR-1 and most of the time for ATSR-2, the 3.7µm channel data are not available during the daytime anyway because of telemetry rate limitations.
Furthermore, while spatial coherence tests work very effectively over the relatively uniform ocean surfaces they are not at all reliable over the land surfaces where there is more much more inherent spatial structure and variance.

Page last modified : Tuesday, 04-Dec-07