
The ATSR Project
|

The AMT-7/ROSSA98 Experiment
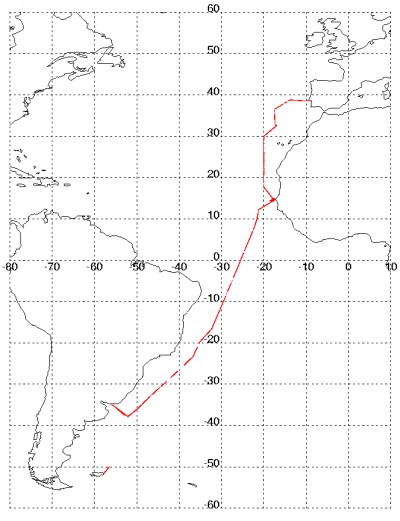
From the 13th September to the 16th October 1998, the Rutherford Appleton Laboratory, in collaboration with the Colorado Center for Astrodynamics Research (CCAR, USA), the Southampton Oceanography Centre (SOC, UK), and the European Joint Reserach Centre (JRC, Italy), made a series of atmospheric and oceanic measurements from the RRS James Clark Ross, along a transect from Grimsby in UK to the Falkland Islands. These measurements were made as a part of the Atlantic Meridional Transect/Radiometric Observations of the Sea Surface and Atmosphere (AMT-7/ROSSA98) joint experiment, operated by the Plymouth Marine Laboratory (PML, UK) and the British Antarctic Survey (BAS, UK).
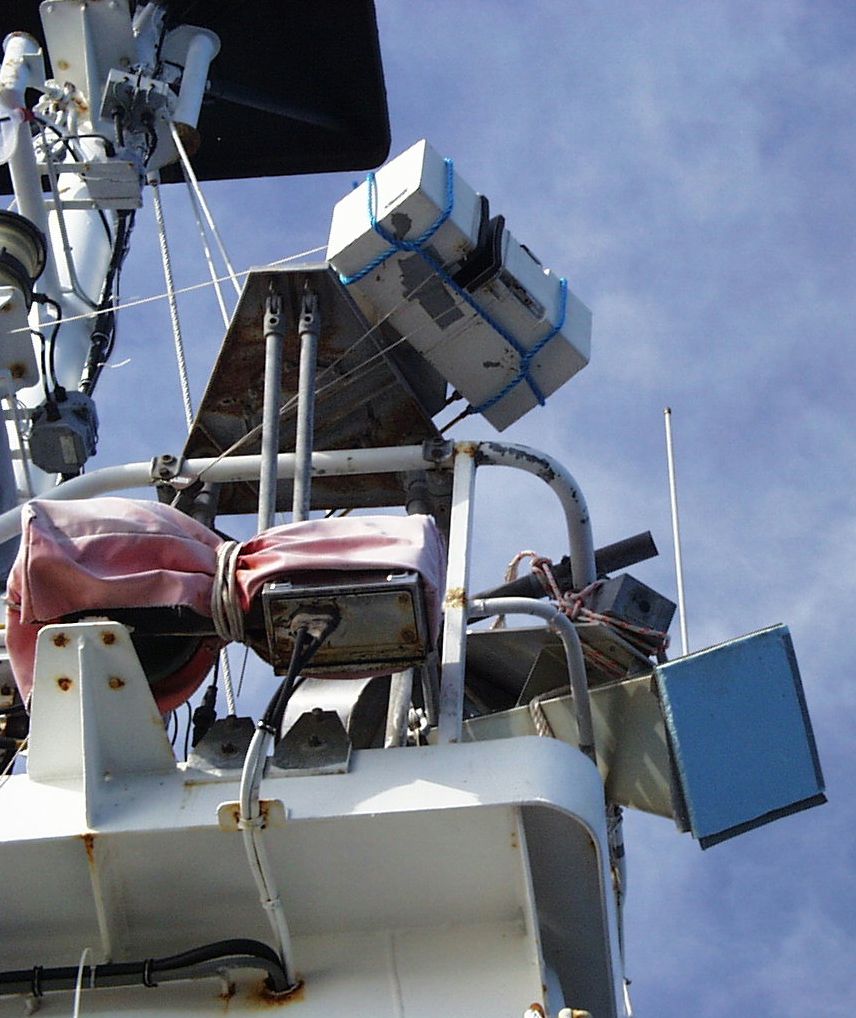
The SISTeR radiometer was deployed at the port forward corner of the JCR's foremast platform (Figure 1, below) and looked down to the sea at an angle of 40° from nadir. Sky radiance measurements were taken at 60°, 40° and 0° from zenith. Each measurement was sampled for 0.8s with a 10.8µm filter.
|
|
|
|
Figure 1 The SISTeR radiometer on the foremast platform of the RSS James Clark Ross for the AMT-7/ROSSA98 experiment. |
Figure 2 Availability of SISTeR data from the AMT-7/ ROSSA98 experiment. |
Supporting measurements included SOAP trailing thermistor temperatures at ~10cm depth, intake and hull temperatures, meterological data and balloon sonde profiles. Figure 2, above, shows the availability of SISTeR data over the cruise period.
SISTeR/ATSR-2 Coincidences
Twelve overpasses were identified. One ATSR-2 GSST overpass pixel was passed as clear by both the forward and nadir GSST cloud masks. A further two were "near misses", that is, adjacent pixels were flagged as clear by both cloud masks. One of these was rejected due to the large difference between local measured bulk and skin temperatures and the very large rate of change of SST with both time and position at the overpass point. Statistics on SISTeR samples which fell within 1, 2, 5, 10 and 20 minutes of the overpass time, the overpass ATSR-2 pixel, and the ATSR-2 pixels whose centres fell within 1, 2, 3, 4 and 5km of the overpass position are given below for the remaining two points. ATSR-2 data was processed with two versions of the SADIST-2 data processor. Version 302 contained the launch GSST coefficients [1] and Version 321, aerosol-robust GSST coefficients [2, 3].
First Overpass
|
|
|||||||||||||||||||||||||||||||||||||||||||||
Table 1.1 Overpass summary. |
Table 1.2 SISTeR SSTs. |
|
|
|||||||||||||||||||||||||||||||||||||||||||||||||||||||||||||||||||||||
Table 1.3 ATSR-2 Three channel nadir-only SSTs (SADIST-2 V302). |
Table 1.4 ATSR-2 Three channel dual view SSTs (SADIST-2 V302). |
|
|
|||||||||||||||||||||||||||||||||||||||||||||||||||||||||||||||||||||||
Table 1.5 ATSR-2 Three channel nadir-only SSTs (SADIST-2 V321). |
Table 1.6 ATSR-2 Three channel dual view SSTs (SADIST-2 V321). |
Second Overpass
|
|
|||||||||||||||||||||||||||||||||||||||||||||
Table 2.1 Overpass summary. |
Table 2.2 SISTeR SSTs. |
|
|
|||||||||||||||||||||||||||||||||||||||||||||||||||||||||||||||||||||||
Table 2.3 ATSR-2 Three channel nadir-only SSTs (SADIST-2 V302). |
Table 2.4 ATSR-2 Three channel dual view SSTs (SADIST-2 V302). |
|
|
|||||||||||||||||||||||||||||||||||||||||||||||||||||||||||||||||||||||
Table 2.5 ATSR-2 Three channel nadir-only SSTs (SADIST-2 V321). |
Table 2.6 ATSR-2 Three channel dual view SSTs (SADIST-2 V321). |
Overpass Plots
Each ATSR-2 overpass plot contains a masked GSST image either for the nadir-only or the dual view GSST product. A map shows the location of the image. An expanded view of the sea area immediately surrounding the overpass point shows the nearest overpass pixel and the course of the RRS James Clark Ross. Overpass data are summarised at the base of the image. The left-hand column contains the overpass location and processing details. The right-hand column gives the temperature of the nearest overpass pixel (0km) and statistics on those pixels with centres within 1, 2, 3, 4 and 5km of the overpass point.
Further plots summarise the SISTeR measurements for the UTC day containing the overpass. Each plot contains three graphs. These show the SISTeR SSTs, binned into 2-minute intervals, the standard deviation of these SSTs from the bin average and the brightness temperature of the sky at 0°, 40° and 60° from zenith. The measurements at 40° are used to correct the upwelling sea radiance measurements.
The standard deviations contain information from the noise floor of the SISTeR detector, the variability of the local SST and sometimes, under broken skies, from incomplete correction of the reflected sky radiance contribution to the upwelling sea radiance.
Summary
The Version 302 three-channel dual view GSSTs agree very well indeed with the SISTeR in-situ SST measurements. The differences between the measurements are always less than 0.1K regardless of the averaging period or area. This is well within the specified accuracy of the ATSR-2 SST product. All other derivations of GSST are significantly warm compared with the in-situ measurements. In particular, the two Version 321 three-channel dual view GSSTs are 0.3K and more than 0.4K warmer than the in-situ measurements.
Contacts
| British Antarctic Survey | http://www.antarctica.ac.uk/ |
| Colorado Center for Astrodynamics Research | http://www-ccar.colorado.edu/ |
| European Joint Research Centre | http://www.jrc.it/ |
| Plymouth Marine Laboratory | http://www.pml.ac.uk/ |
| Southampton Oceanography Centre | http://www.soc.soton.ac.uk/ |
References
| [1] | A.M. Zavody, C.T. Mutlow and D.T. LLewellyn-Jones 1995: A radiative transfer model for sea surface temperature retrieval for the along- track scanning radiometer, J. Geophys. Res., 100, 937-952. |
| [2] | C.J. Merchant, A.R. Harris, M.J. Murray and A.M. Zavody 1999: Toward the elimination of bias in satellite retrievals of sea surface temperature. 1. Theory, modeling and interalgorithm comparison, J. Geophys. Res., 104, 23,565-23,578. |
| [3] | C.J. Merchant and A.R. Harris 1999: Toward the elimination of bias in satellite retrievals of sea surface temperature. 2. Comparison with in situ measurements, J. Geophys. Res., 104, 23,579-23,590. |
Overpass Plots
Plots...

Page last modified : Thursday, 06-Dec-07