
|
|
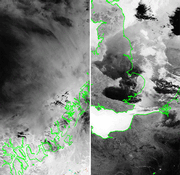 |
Two images taken on Jan 25th 2000 from the last dataset received by ATSR-1 before the ERS-1 failure
The image on the left depicts Greenland and is the last image from the ATSR-1 mission.
The image on the right is of the UK / France and preceeds the last image by about 1/4 of an orbit
The coast flag has been set so you can see them clearly.
|
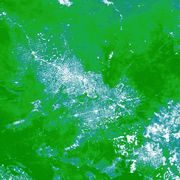 |
A striking image showing the destruction of the Brazilian rainforest.
This is an 11 micron day-time image acquired on 28th August 1991 covering an area of 512x512 square km.
The cleared areas show up brighter than the surrounding vegetation because they have different thermal properties and can be up to 4K warmer during the day.
|
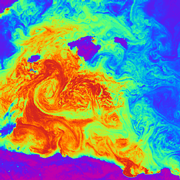 |
In this night-time image, the coldest areas - which include all the land - are shown in purple and blue, whilst yellow and orange are used to represent successively warmer temperatures over a total range of 280-295K. The three blue-purple islands in the top half of the image are the Balearics, (from left) Ibiza, Mallorca and Menorca; the land at the bottom of the picture is the north coast of Algeria. Other more tenuous blue regions are cooler sea except for the extreme north-west corner of the image which is the Spanish coast. However the most striking feature of this image is the intricate pattern apparent in the Mediterranean Sea temperature. Eddy structures ranging in size from less than 10km to nearly 100km decorate the entire sea area. Note that the warmest water appears to originate from the Gulf de Bougie on the Algerian coast.
(This is an 11 micron night-time image acquired on 9th May 1992; the area covered is 512 x 512 square km.)
|
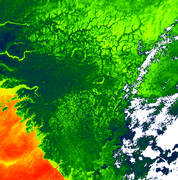 |
This image shows a stretch of Western Africa known as the Grain Coast. The orange-red region in the south-west corner of the image is the Atlantic Ocean. Most of the land area is Senegal, although the Gambia, Guinea Bissau and Guinea are also represented. As this is a night-time image, the land at around 290K is several Kelvin cooler than the sea. The white areas in the south-east region of the image are clouds.
This picture has been scaled to highlight the circular feature slightly north-west from the centre. Almost 40km in diameter, its appearance is suggestive of a meteorite impact crater, but confirmation of this theory would require a detailed analysis of the material in the `crater'. A further striking aspect of this image is the fractal appearance of much of the land surface and several coastal inlets.
(This is a 3.7 micron night-time image acquired on 23rd January 1992; the area covered is 512 x 512 square km.) |
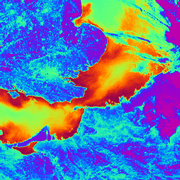 |
London and many other English cities can be seen as bright thermal `footprints' in this night-time image of England, France and the English Channel. In the false-colour representation used here, temperature increases through blue and yellow to orange over a temperature range of 278-288K.
The River Seine is the most prominent feature on the French landscape, but Paris is just beyond the lower extent of this image. The temperature gradients seen in the North Sea are characteristic of that region ranging from 290K in coastal waters to about 280K mid-channel.
The clouds in the image are about as warm as the land and are thus indistinguishable by their colour. However they are immediately apparent to those familar with the local geography or indeed no Channel Tunnel would be required!
(This is a 12 micron night-time image acquired on 7th September 1991; the area covered is 512 x 512 square km.)
|
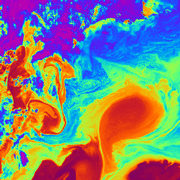 |
This image shows a warm core ring from the Kuro Shio current just east of Japan's main Honshu Island. Note the intricate patterns described in the sea-surface temperature. In addition to their usefulness in studying ocean dynamics, such data have more immediate applications; fish favour the fronts between warm and cold water and sea-surface temperature images can be used to locate these fronts, a fact exploited by the fishing industries in several countries!
(This is an 11 micron day-time image acquired on 28th August 1991; the area covered is 512 x 512 square km.) |
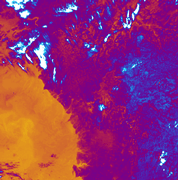 |
A useful application of ATSR data is the detection of forest fires and other hotspots on the Earth's surface. Numerous bush fires are visible as tiny yellow spots in this night-time image of the West African Coast. Most are in the south-east of the image which is Sierra Leone. In this false-colour representation the coldest areas (clouds) are blue, with purple and yellow representing increasingly warmer temperatures.
In this night-time image, the large yellow area is the Atlantic Ocean with the cooler land appearing red. The average temperature of the fire pixels is about 300K, but this is not representative of the fire temperature as only a small fraction of the 1 square kilometre pixel is actually on fire.
With the current instrument, the maximum measurable temperature is only 320K. However ATSR-2 (due to be launched in 1995) will have the facility to measure temperatures above 500K.
(This is a 3.7 micron night-time image acquired on 26th January 1992; the area covered is 512 x 512 square km.)
|
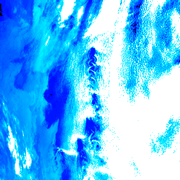 |
Cloud studies form a major part of the ATSR research effort. This striking picture shows unusual cloud formation around the South Sandwich Islands in the South Atlantic. Most of the image is sea and the islands themselves are discernible only as the points of origin of several sets of cloud formation. Most striking is the stable and regular pattern of crescent-shaped clouds (shown in white) which are shed alternately from the east and west sides of the northern-most island. Such a pattern is known as a Von Karman vortex street, and this particular manifestation is the subject of a detailed study at RAL.
(This is an 11 micron day-time image acquired on 4th March 1992; the area covered is 512 x 512 square kilometres.)
|
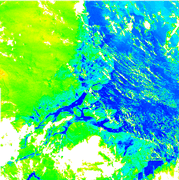 |
On this image the mighty Amazon River is shown spilling into the Atlantic Ocean.
The simple colour scheme used shows clouds as white, the land as green and the
sea and rivers as blue.
The other images in this directory are single-wavelength views which have had
no atmospheric correction applied. However in the tropics the effect of the
Earth's atmosphere can depress the temperature as measured by a satellite-borne
instrument by as much as 10K.
This image is a result of processing data from three of ATSR's channels and
using both the instrument's views to make the appropriate atmospheric correction.
The large width of the Amazon enables an accurate determination of the river's
temperature to be made, (300K in this image). In the case of rivers narrower
than ATSR's 1km resolution, temperature measurements are inevitably an average
of both land and water temperature.
(This is a multi-channel, dual-view, day-time image acquired on 11th August
1991; the area covered is 512 x 512 square km.)
|
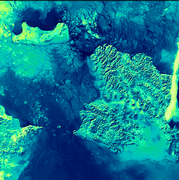 |
East meets West in this picture of the Bering Strait which was acquired using
ATSR's 1.6 micron channel. Radiation measured at this wavelength is essentially
reflected `sunlight' rather than thermal emission. In the colour representation
used above, the brightest areas are the most highly reflecting.
Verging on the Arctic Circle, the sea in this image is packed with ice floes.
In the cracks and gaps between the ice, the much less-reflective water surface
appears almost black. The brightest area is the finger of cloud on the western
side of the image. Also brighter than the icy sea, are the three land areas
in the picture. From the western side of the image, the eastern extremity of
the Russian Federation reaches out towards the tip of Alaska. The International
Date Line bisects the inter-continental gap and then veers south-west keeping
St. Lawrence Island with Alaska a day behind the Russian Federation. ATSR data
have proved very useful in the detection of sea ice and the location of icebergs.
(This is a 1.6 micron day-time image acquired on 5th February 1992; the area
covered is 512 x 512 square km.)
|
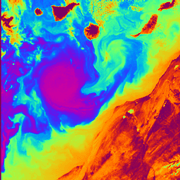 |
The region extending from the Canary Islands to the coast of Western Sahara
is shown in this night-time thermal image. The most dramatic feature of this
picture is the giant warm eddy structure in the Atlantic which is at a temperature
of around 295 K. Formed as a result of the turbulent mixing of the cold African
coastal waters with the warmer central Atlantic water, this structure is around
200 km in diameter.
Across the top of the image are several of the Canary Islands, from left, Gomera,
Tenerife, Gran~Canaria and Fuerteventura. Although small, the islands exhibit
large variations in altitude and therefore temperature, as can clearly be seen
in the image, with the more-elevated central parts of each island appearing
colder (darker) than the coastal areas.
Note what appears to be a fine-structured warm emission (shown in yellow) spreading
out from the North-Eastern extremity of Gran Canaria. This matter is at a temperature
of around 290K and is probably an example of orographic cloud formation.
(This is a 3.7 micron night-time image acquired on 19th October 1991; the area
covered is 512 x 512 square km.)
|
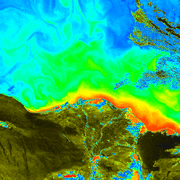 |
This image shows the Nile Delta, Egypt, and the Mediterranean Sea. The temperature
range in the image is 280-292K. In the colour scheme used, dark brown and blue
are the coldest, through to green mid-range, with yellow and orange in the warmest
areas. Looking at the bottom centre of the image, the Nile is clearly visible
as a blue line meandering northwards. A little further along its course the
river goes through Cairo which is the large orange region. A short distance
after Cairo the Nile branches into two rivers -- the Rosetta Nile to the west
and the Damietta Nile to the east. The bright blue spots within the delta are
towns.
The orange-red blush around the coast is warm shallow water at a temperature
of around 290K. Lake Qarun, the bright red area to the south west of Cairo is
the warmest feature of the image. Further west is desert and a number of long
sand dunes are discernible as dark-brown strips running approximately north-south.
The only clouds in the image are the brown filamentary structures in the north-east
corner.
(This is a 3.7 micron night-time image acquired on 9th May 1992; the area covered
is 512 x 512 square km.)
|
|

Page last modified : Thursday, 06-Dec-07
|

